By Emily Gong published on May 27th, 2023
DataSquad Spotlight: Tristan Dewing

In Spring of 2022, Tristan Dewing joined the Norman Powell Student DataSquad as a Data Science Consultant. Since then, he has completed five long-term projects and 15 consultations, which has been invaluable for the DataSquad team and the Data Science Center (DSC). Tristan recently graduated from UCLA with a degree in Statistics in Winter 2023, but continues to serve the group one last quarter before joining the industry.
Among all his experiences at DataSquad, the consultant said his favorite was working with researchers who study “a plethora of different subjects” - social science, finance, social media, etc. Engaging with different data types, whether it’d be Twitter text data or more traditional census data, Tristan said he’s “enjoyed the process of not only helping researchers with their task but also picking up new skills along the way.”
More specifically, Tristan mentioned 2 areas where he felt he’s grown since being part of the team: 1) How to properly collect and store data and 2) the importance of recognizing which data format is best suited for which tasks. Through his social media project, the consultant stepped outside his comfort zone and explored API usage, which led to wrangling with various forms of data, including JSON files, text files, and tabular data. He said the process enabled him to expand his repertoire and improve his technical skills by forcing him to think about the collection and storing phase of data science more carefully. Besides data collection, Tristan mentioned the importance of having the right data format for certain data tools. For example, Tableau works best with long data (one observation per row) rather than wide data (aggregated statistics) because the tool focuses on creating summaries. Following that logic, flattening already pivoted data in Python or R before importing it into Tableau can be extremely useful.
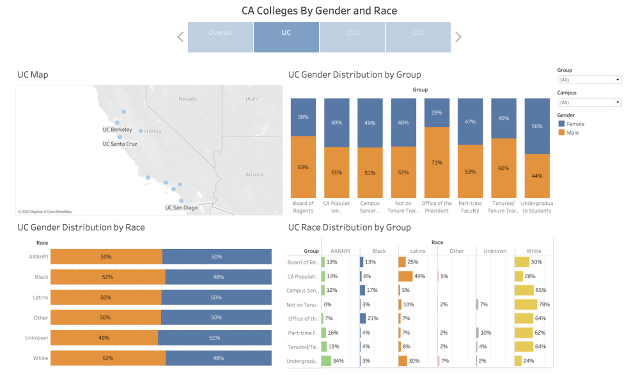
Among all the projects Tristan has worked on, the consultant said his favorite was the one on California colleges’ demographics, which utilized Tableau extensively. To learn more about the demographic trends in UCs, CSUs, and CCCs, Tristan worked with a researcher to analyze gender and race ratio in undergraduates, tenured faculty, and district leadership. To have a base metric, they also incorporated California population data from the census as part of the project. After creating different graphs, Tristan combined them into an interactive dashboard with multiple drop down filters, as shown below. “It was interesting to see the demographic trends within these higher education institutions as a California native,” Tristan commented.
Tristan expressed his gratitude for the team and hopes to “leave DataSquad a better place than it was before.” “Being a small team,” Tristan said, “DataSquad members got to know each other very well, and we have confidence in everyone’s capabilities.” He highlighted that the DSC is a great resource for anyone at UCLA who’s interested in employing statistical programming in their work; the consultation service is an accessible opportunity that caters towards their needs. The consultant also hopes the DataSquad will grow into a bigger team in the future.
Some fun facts about Tristan:
- Favorite part of DataSquad: the Data Science Center in YRL
- Favorite package: Pandas
- Favorite IDE: Visual Studio Code
- Favorite condiment: ranch dressing
- Favorite UCLA building: Luskin Center