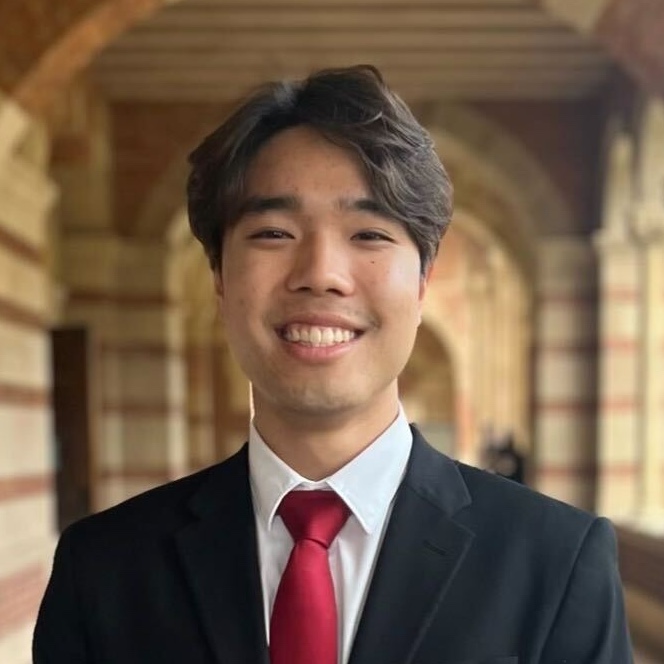
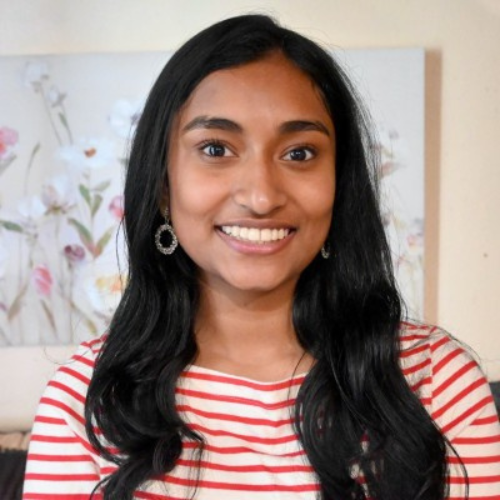
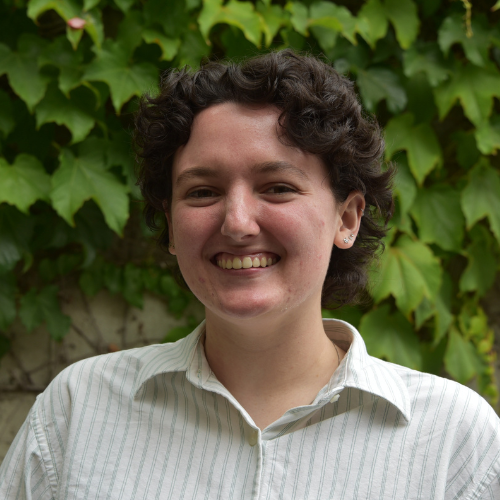
The DataSquad is a team of undergraduate students who support data-related projects at UCLA. Our mission is to facilitate data processes for sustainable, replicable, and reproducible research, teaching, and workflows. Members of the DataSquad do not create, interpret, analyze, dictate, or otherwise change the nature of data sets outside of the prescribed task. The DataSquad is a part of the UCLA Library Data Science Center service and was made possible with a generous gift from Norman Powell. The UCLA DataSquad service is a chapter of the DataSquad International, a service model initiated by Carleton College.
Our Services
Our aim is to make your research and work life easier!
Coding Consultation
Do you need help with R, Python, Tableau, or other statistical programming tools? We can help you write efficient and cohesive code and recommend the best coding practices and tools for your project.
Data Cleaning and Manipulation
Do you need help with collecting, cleaning, and using data? Our team can help clean and manipulate your data in Python, R, and SQL.
Data Visualization
Need help with visualizing or displaying the data you have? Our members can help build informative and attractive visuals using Tableau, R’s ggplot, base R, and Python.
Statistical Consulting
Do you need help understanding statistical concepts or how to implement analysis using statistics in your projects? Our members have strong backgrounds in the subject of statistics.
Eva Horna Lowell and Sean O’Fallon, graduate students in the department of Ecology and Evolutionary Biology, are researching ant nest behavior in the Pinter-Wollman Lab at UCLA. Initially, their goal was to study the differences in ant nests exposed to various environmental conditions using wax casts of the tunnels. However, because the tunnels were so intricate and delicate in nature, the casts kept breaking, making it necessary to approach the problem in a different way.
Broken wax ant nest cast pieces spread out on a table. Lined up next to each other to put back together like a puzzle Many different parts of the ant nest cast on a table
Broken pieces of the ant nest cast. The segments had to be painted in order for the scanner to see them.
At the Data Science Center (DSC) Lux Lab, Emerging Technologies Librarian Doug Daniels helped them figure out a way to record detailed information about the nests without sacrificing the integrity of the tunnels. Using an Artec Space Spider Scanner with a 0.1 mm resolution light scanner, Lowell and O’Fallen were able to get 3D scans of the ant nest. There were some challenges, given that the casts had already broken into pieces, but with a collaborative effort, they were able to start the reconstruction of the nest virtually. Communication was key, as you can imagine how hard it is to describe the orientation of an object purely through video chat and screen sharing. It’s also interesting to note that the casted pieces of the nest had to be hand-painted for the scanner to see them. Originally translucent, the pieces were unable to be properly scanned. The scanner simply could not make out their shapes because it was a light scanner as opposed to a laser scanner.
3D representation of the ant nest on the computer. Each broken segment is shown as a different color.
A 3D representation of a part of an ant nest on the computer. Each broken segment is a different color in the software.
Date: 2021-01-22
Author: JESSICA CHUN
Category: Data Science Center
Squirrels in Motion
By JESSICA CHUN on Fri, 2021-01-22 13:24
Amanda Robin is a PhD candidate in the Department of Ecology and Evolutionary Biology, researching behavior and locomotion of wild squirrels. In 2019, Amanda and her team equipped wild California ground squirrels (Otospermophilus Beecheyi) with motion-sensitive collars. These collars allowed them to record accelerometer data at 100 values per second as the squirrels moved through their environment.
Amanda and the rest of the Squirrel Gazer team (click here to check out her blog!) observed the squirrels’ behaviors and characterized their activities with labels such as “sitting”, “standing”, “laying down”, and more. Using the motion data and the labels that were created, Amanda wants to utilize machine learning to better understand behavior and patterns. Currently, the Data Science Center is helping her use R and R packages to analyze the data and develop neural networks to predict a squirrel’s activity and behavior.
A squirrel with the motion sensored collar standing on its hind legs A squirrel with the motion sensored collar sitting in a tree
Squirrels with motion sensored collars on.
We interviewed Amanda to learn more about her inspiration and her project!
What got you interested in Ecology and Evolutionary Biology?
Squirrels! When I was a community college student, I thought I wanted to be a clinical psychologist; however, when I got to UC Berkeley, I learned more about animal psychology. I started in the Jacobs Lab of Cognitive Biology and found that I liked animal psychology more than human psychology. Currently, I am in the Nonacs Lab at UCLA. One of my advisors is Dr. Jennifer E. Smith, an Evolutionary Behavioral Ecology researcher from Mills College. It’s been fun trying to figure out what animals are doing in nature!
Why did you choose to specifically study the behavior patterns of California ground squirrels?
California ground squirrels are ecosystem engineers! They help provide protection and even housing for other animals. We are looking at how different squirrels behave underground because it never really has been done before. Patterns such as are some of them in charge of building more than others (female, male) can be discovered. The question was, “How do we get underground???” We couldn’t cast the burrows, similar to how researchers study ant burrowing, because the tunnels and pathways were too extensive. People have tried cameras, but you can’t really determine measurements with them. That’s when we decided to use accelerometer, gyroscope collars, working towards modeling the 3D paths! Eventually, we want to use the collars and our machine learning algorithms to study Californian squirrels and their behavior underground.
What has been the most challenging part of the experiment so far?
We started trying to build the collars, but that was a mess. Eventually, we bought the collars that we use now. Also, following the squirrels for three hours, tracking their every move in summer, is very difficult. When you are trying to connect data collected on wild animals in the field to computer science, there are so many other steps that you have to connect to make sure you are providing the machine learning algorithms meaningful data.
Date: January 2021
Author: Jessica Chun
Category: Data Science Center
Analyzing Ancient Chinese Buddhist Text with Python
By JESSICA CHUN on Fri, 2021-01-22 13:20
A graduate student from Asian Languages and Cultures sought help to analyze ancient Buddhist texts semantically, including extracting the meaning of the texts, and comparing the similarity between different texts quantitatively. The goal of this consultation was to document experience using Python and to work with an ancient Chinese Buddhist dialect. This required some basic analysis on several dozen text documents with a twist.
There is a standard set of popular Natural Language Processing (NLP) tools that is our center’s ‘go to’ toolbox including:
Spacy
Scikit-learn
Data visualization tools like word clouds
While analyzing text is a pretty straight-forward process, there were many unique challenges in this consult. One challenge was that the documents were Buddhist texts from the Ming dynasty. Most of the text tools we use are designed for western languages, so we had to be creative with how we addressed common concerns such as Chinese character segmentation. The source text was originally unsegmented, meaning that it was just a contiguous block of text. Using the Python library however, we were able to divide text based on white space and vocabulary matching. While this segmented the text, there was a preexisting default choosing to use the modern Chinese dictionary, which did not match up perfectly with the older syntax. Since the analysis was done using a modern Chinese dictionary, we explored replacing it with an ancient Chinese corpus and dictionary. Several are maintained by the Georgetown Treebank project, a text and language analysis tool.
Once the source files were segmented, we were able to use some of the scikitlearn tools for basic statistical analysis (TF-IDF), following this article pretty closely. We also used several visualization tools, including the word cloud tool to provide some baseline visualizations.The goal was eventually to explore automating tagging content following an example at Stanford.
Date: January 2021
Author: Jessica Chun
Category: Data Science Center
Como-Q - Your Skincare Assistant
By William Foote on Fri, 2022-05-13
When Isabel Light filled out a request form for the UCLA Datasquad to help her code a passion project, she didn’t know she’d be the first external applicant the team had ever helped.
Isabel is a senior Microbiology, Immunology, and Molecular Genetics major at UCLA and prior to her project, the Datasquad had only done consultations referred to them from within the UCLA Data Science Center.
Norman Powell Data Science Consultant Will Foote helped on the coding aspect of the project, which had goals of creating a program that screens a skincare product’s ingredients to check if any ingredients are comedogenic (pore-clogging). Isabel said the program, tentatively named “Como-Q,” was inspired by the fact that some skincare products (and many general hygiene ones) are either unlabeled or mislabeled when it comes to their pore-clogging properties.
“One of the main ingredients in many shampoos is comedogenic,” Isabel said. “But, no one really seems to know or care because it’s not a skincare product…I wanted to build a tool that helps people easily identify if an item is pore-clogging even if it’s not a typical skincare product.”
She also wanted to make a highly customizable tool that fits the needs of each person.
“Not everyone’s skin reacts the same to ‘comedogenic’ items,” Isabel said. “Some people with great skin have told me coconut oil has worked wonders for clearing up their acne, even though it’s considered to be a very pore-clogging ingredient.”
With these goals in mind, Will and Isabel met three times over the course of Winter and Spring quarters and were able to get a base application to work in R. As their consultations wound down, Isabel was also left with action-items to continue moving the application towards its end goal despite coming in with little programming experience.
“This is something that I’ve wanted to do for a long time,” Isabel said. “So, I’m glad that I could get help on the project from the Datasquad and have something to build off of going forward.”
In its current form, Como Q functions from the R console and needs two elements to work, a list of bad ingredients and an ingredient to search for.
Moving forward, Isabel wants to build on the coding lessons she’s been left with to make the program more efficient and user friendly. Among these, she wants to add functionality for taking in an entire list of ingredients (as opposed to a single one) and use Como-Q to flag which of the ingredients are potentially pore-clogging.
She also wants to build a more user-friendly interface by putting Como-Q’s functionality into R Shiny, a tool that helps create easy-to-use and easy-to-deploy applications. The hope is that one day the app is available online and accessible to anyone with the same questions about a product’s comedogenic properties.
The UCLA Datasquad is actively accepting requests to help the UCLA community reach its data science needs regardless of their technical background. Whether you need help with coding, data cleaning, data visualization, or really anything data-science related, the Datasquad has you covered!
Date: May 2022
Author: William Foote
Category: UCLA DataSquad
Civilian Deaths at Hand of Police
By William Foote on Fri, 2022-05-20
Some projects require multiple sets of eyes and a couple pairs of hands to get the job done.
That was the case when Dr. Terrence Keel brought his project to the UCLA Datasquad from the UCLA Biocritical Studies Lab. Julia Wood, a Norman Powell Data Science Consultant on the UCLA Datasquad, took the lead on the consultation, which analyzed numerous data sources to quantify civilian deaths at the hands of police in the US. The project looked at data across different times and spaces to quantify and visualize these fatal encounters.
Ethan Allavarpu joined the project’s efforts shortly after being hired as the Datasquad’s second Norman Powell Data Science Consultant. The research tasks touched on many ends of the data science process: from merging four different datasets to the end goal of visualizing the data across the country.
Sometimes challenges arose in keeping lines of communication open and efficient with the multiple different stakeholders and consultants working on the project. When Julia and Ethan were able to get past these obstacles, “the project flowed well,” Ethan said.
It was off to the races once the ball kept rolling. Julia handled tasks including data cleaning and data visualization. Specifically, Julia was responsible for creating Tableau dashboards that allowed researchers to visualize fatal encounters with police by weapon and location. Not only did she recreate Tableau-versions of graphs that Dr. Keel had worked on earlier, but she was tasked with creating Los-Angeles-specific dashboards as well.
Ethan joined the project while Julia was readying for graduation in Winter 2021. One of the biggest challenges was identifying discrepancies between two datasets and highlighting names that were previously hidden in the datasets. Dr. Keel’s team called these individuals “the hidden.”
Ethan also applied statistical methods to the data on top of helping clean the data. He ran chi-square tests to determine which states/localities had a statistically different number of previously unreported deaths. Using these findings, researchers hoped to be able to identify outlier locations – ones having significantly more/less deaths compared to other areas – to give researchers a sense of which places might need to be investigated further.
Through their joint efforts, Ethan and Julia’s work gave the researchers at the Biocritical Studies Lab a better understanding of the problem numerically and visually. Julia spoke to the heightened stakes that come with consulting a client versus doing a course-related project in the classroom.
“In class, the end goal is presenting something at the end of the quarter,” Julia said. “Working with a client, you really have to take the right steps to make sure you don’t mess up. We’re responsible for making sure the work we produce is reputable, reproducible, and ready to be published.”
Overall, she believes the Datasquad has delivered on that task.
Date: May 2022
Author: William Foote
Category: UCLA DataSquad
DataSquad International
By William Foote on 2022-05-24
One of the most important tools a UCLA DataSquad member can have in their arsenal is being open to new opportunities.
This was the case when Norman Powell Data Science Consultant Will Foote took on a Tableau project with DataSquad International, the nascent global organizing group for the DataSquad. He was not the most skilled on the team in Tableau nor had he used it much in a professional setting. Nonetheless, he felt up to the task.
Will has been working with Tim Dennis of the UCLA Library Data Science Center and Paula Lackie of the Carleton College DataSquad who are leaders of the DataSquad International team. He was tasked with cleaning and visualizing survey data to explore what the current obstacles to employing students in Data Support Services (DSS) are around the world.
The data analysis looked into the relationship between these obstacles and variables such as location, whether or not the DSS team employed students already, and whether or not the DSS team was established or in the process of doing so. Will leveraged R to clean the data to work towards the vision Paula and Tim had for the project.
Cleaning and processing data in R wasn’t a new task for Will who had done this many times in his Statistics coursework. But doing so in Tableau with an expectation of creating publishable results was.
To accomplish this task, Will had to do something that every Norman Powell Data Science Consultant must: communicate and be able to learn on the fly. Will was in frequent correspondence with Tim and Paula throughout the project to get advice and feedback on the work that had been completed to make sure all parties’ visions aligned. Even more often, Will was forced to learn new functionalities of Tableau that he hadn’t used before.
For him, it was about making connections between the concepts he’d learned in other courses and programming languages in order to decrease the perception of “newness” of the project. Seeing the problem as transitioning between similar languages made it much easier to tackle than imagining it as learning an entirely new one.
Will is in the final stages of the analysis which will be used as material outside of just the research sphere. Upon the project’s completion, Paula, Tim and the rest of the DataSquad International team plan to synthesize Will’s analysis with their own recommendations about how to best address obstacles to student employment for DSS organizations. The DataSquad International will be publishing these findings on their website and at upcoming European and U.S. conferences this summer.
Date: May 2022
Author: William Foote
Category: UCLA DataSquad
The First UCLA DataSquad
By William Foote on 2022-06-02
The first UCLA DataSquad cohort is graduating together.
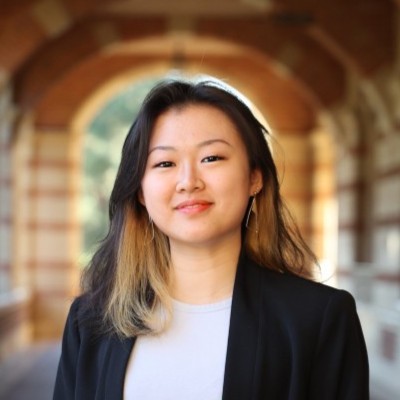
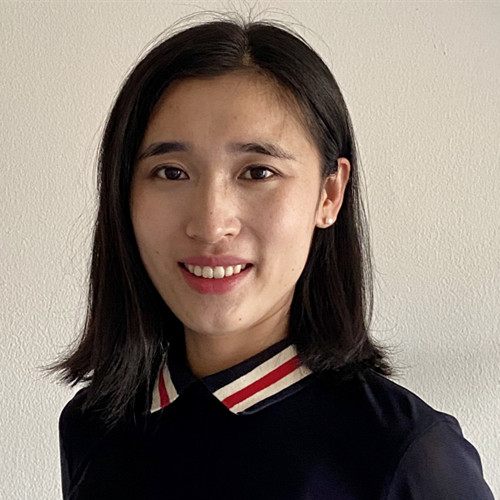
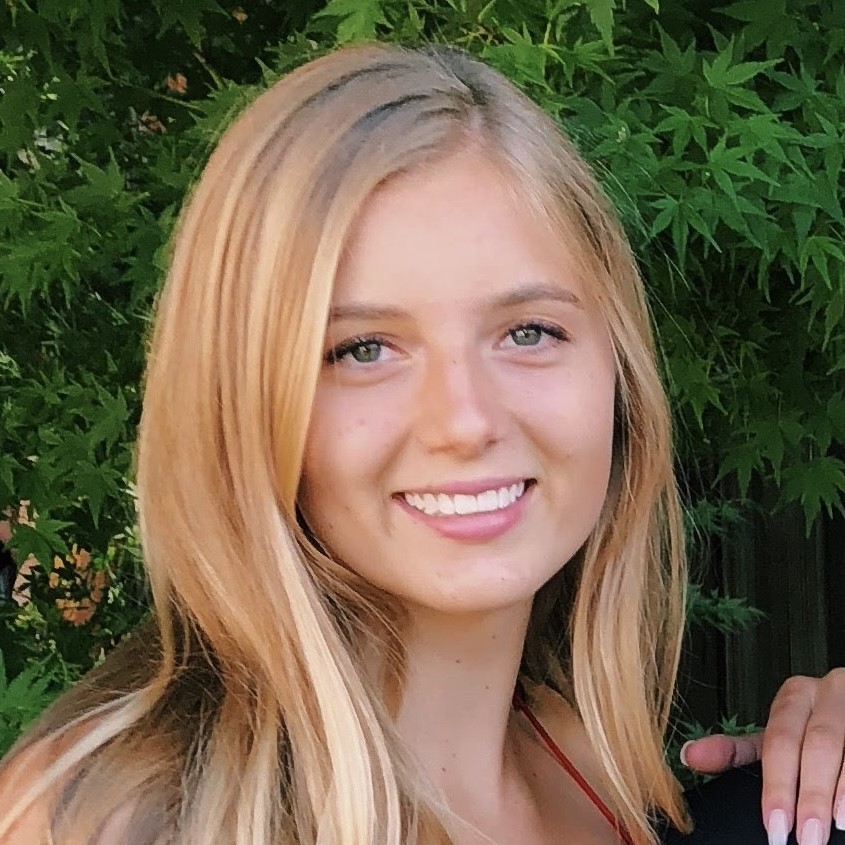
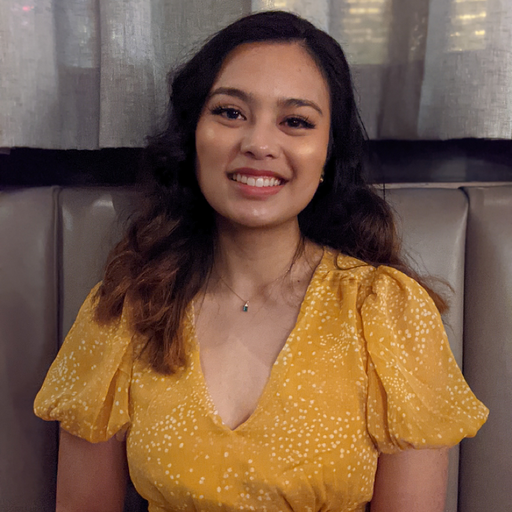
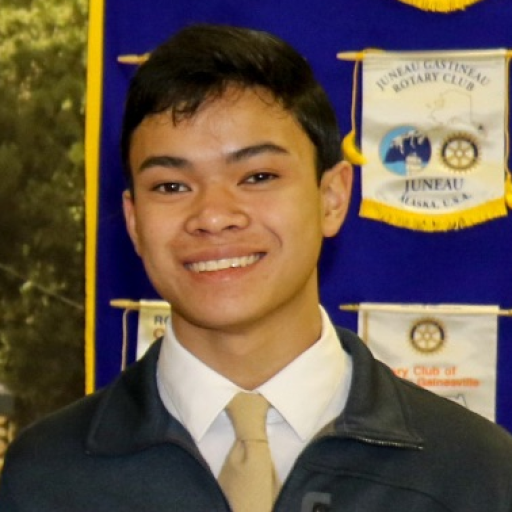
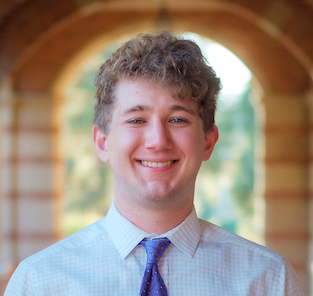
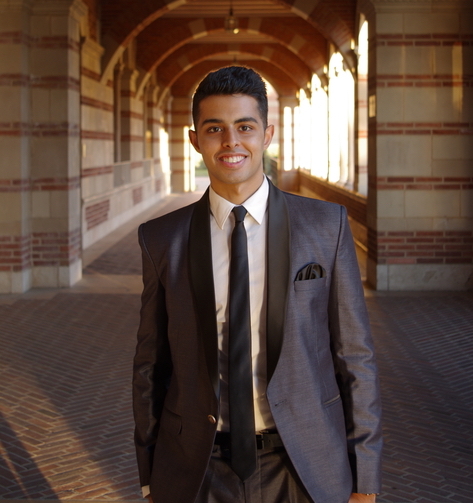
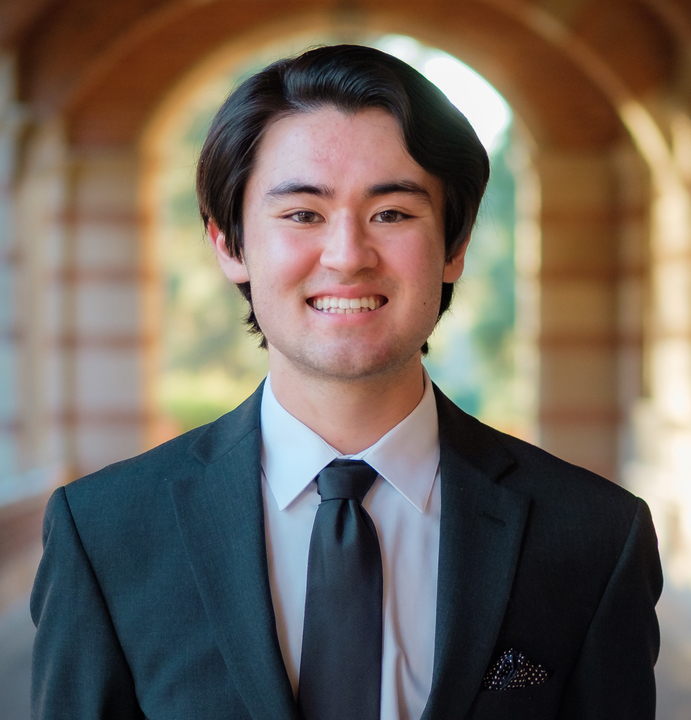
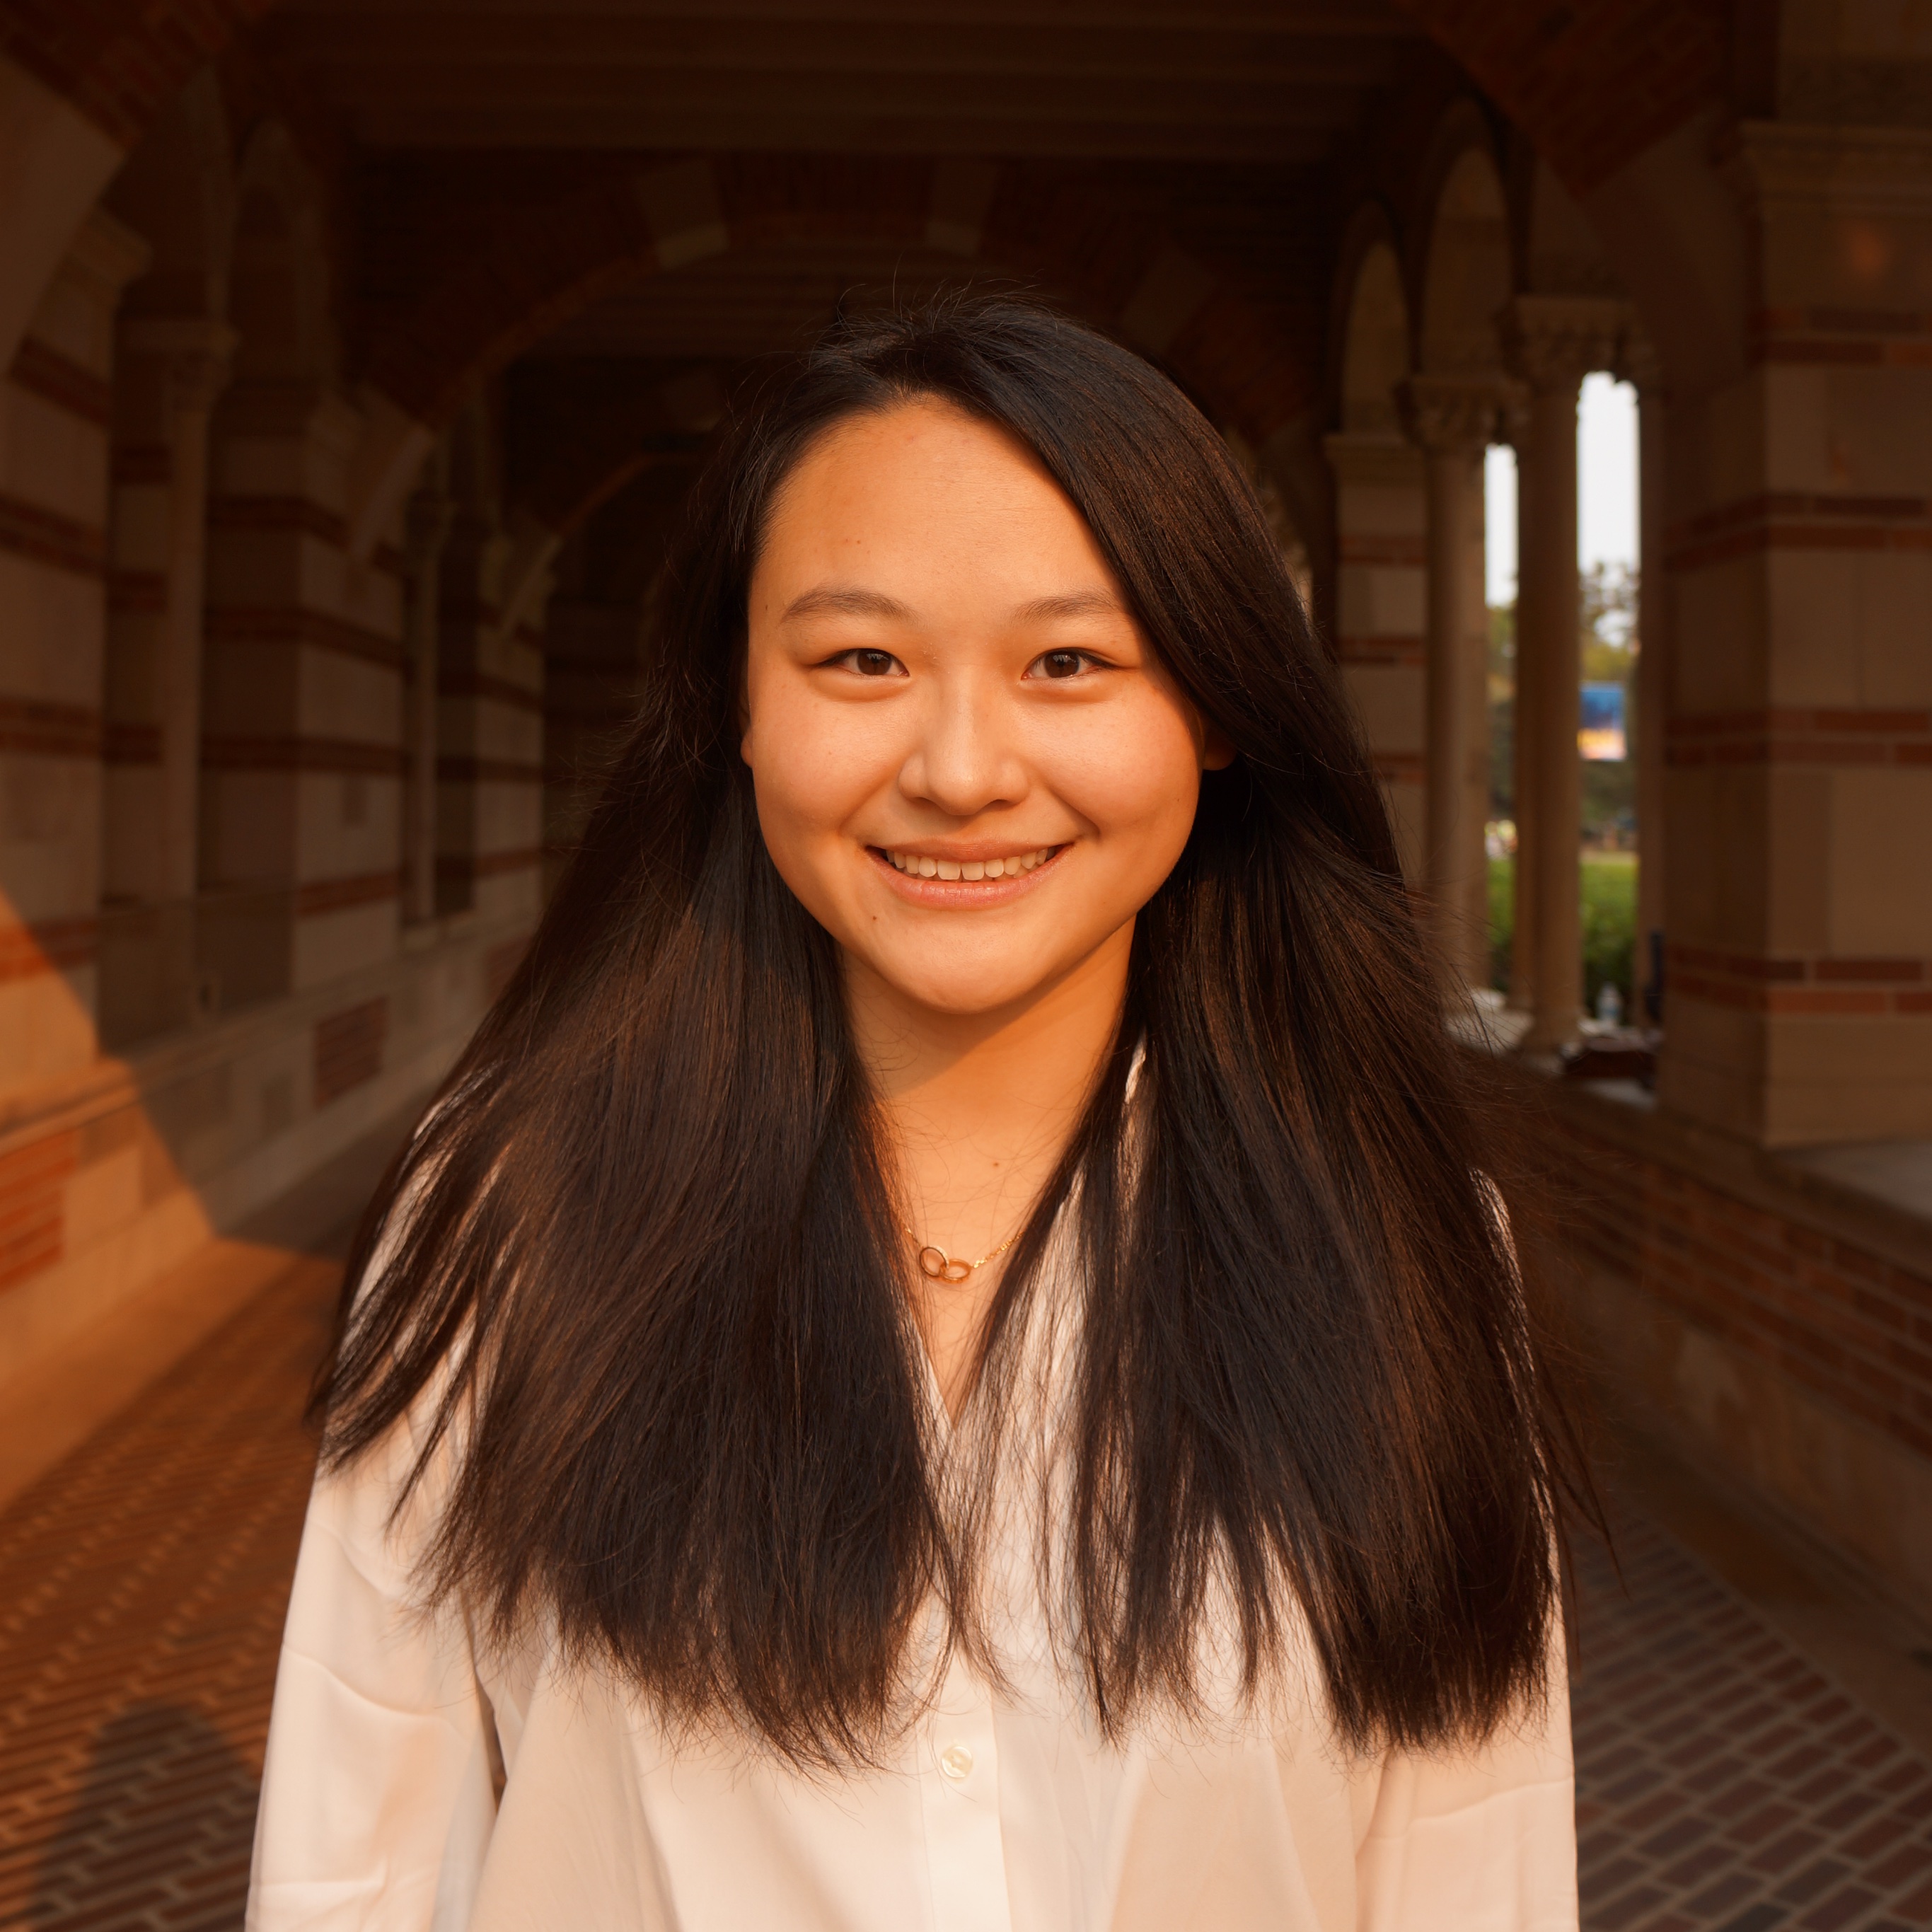
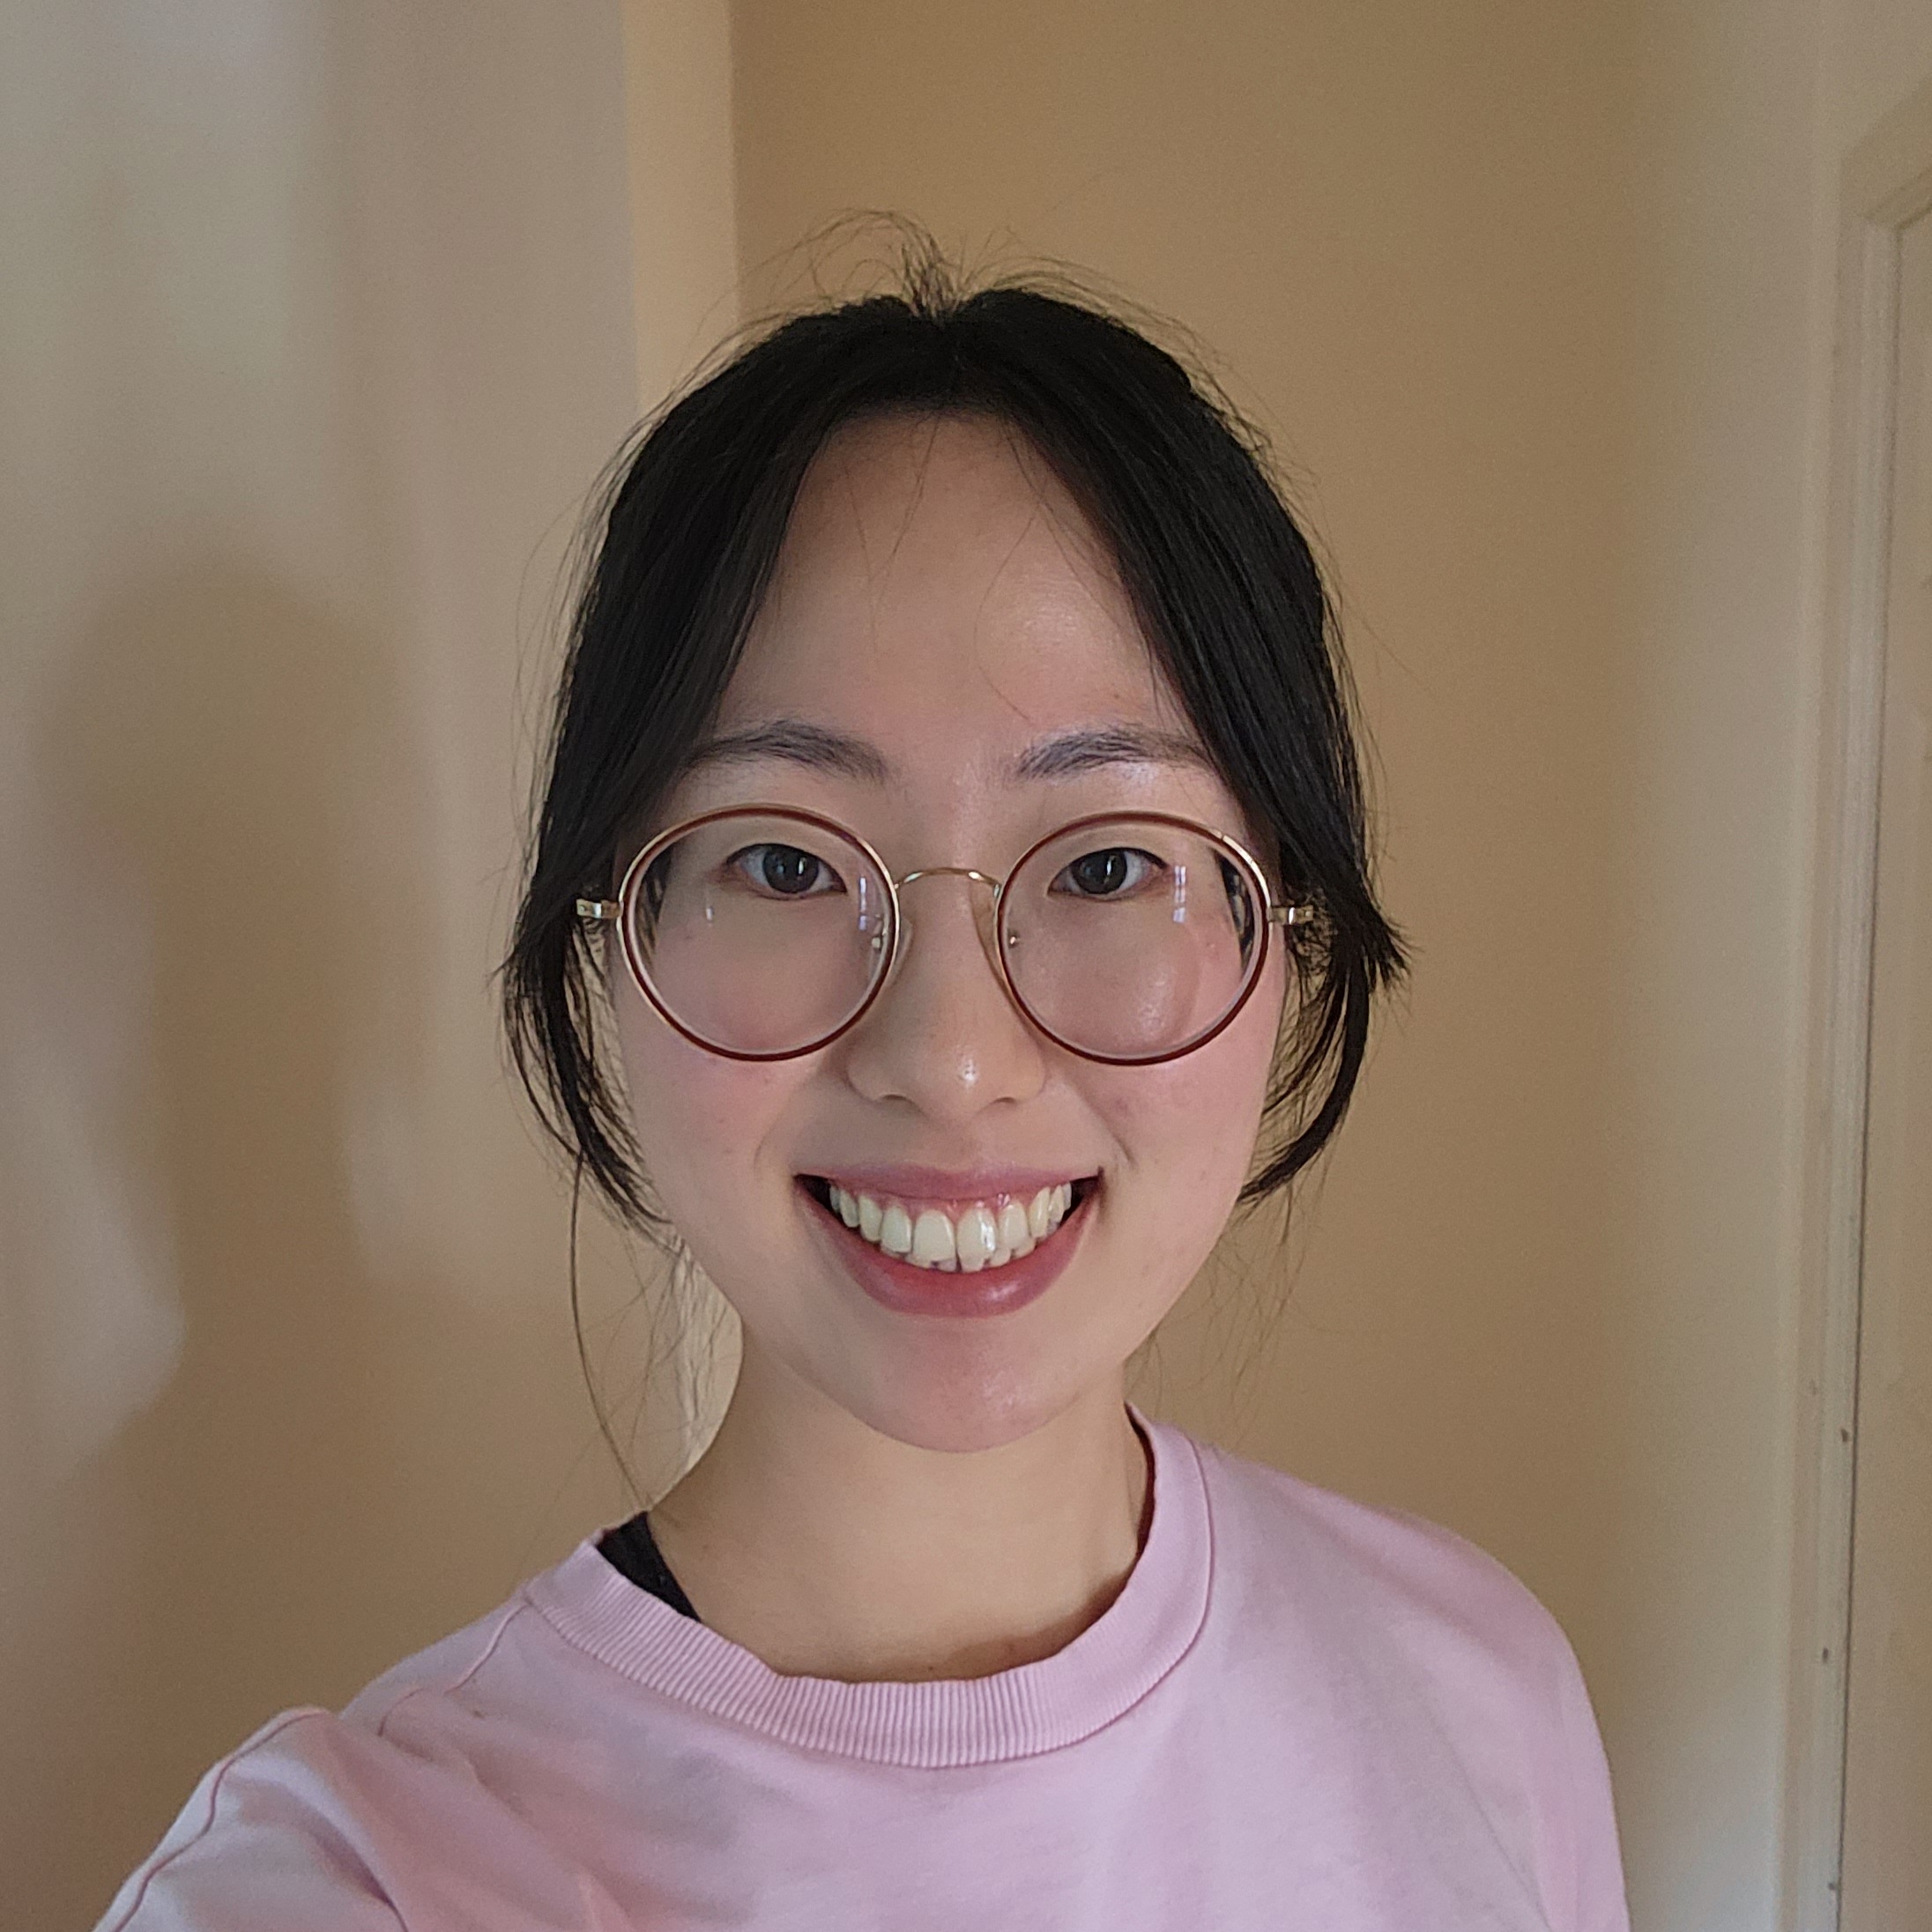
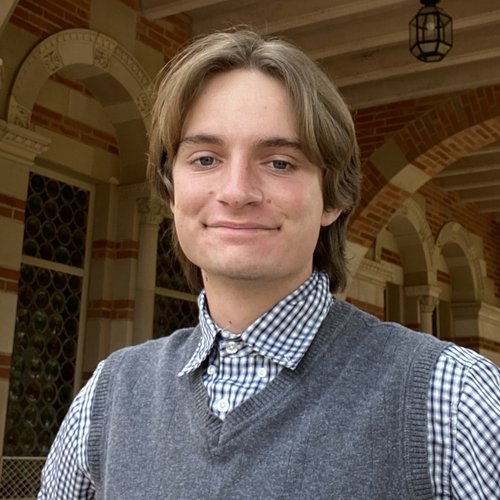
The team led by co-directors Tim Dennis and Zhiyuan Yao was composed of project manager Keona Mae Pablo, two Norman Powell Data Science Consultants (NPDSC), Julia Wood and Ethan Allavarpu, and hybrid NPDSC/technical writer Will Foote, for the 2021-2022 academic school year.
The First Cohort
The student-quartet only worked together for one full quarter, but their work set the stage for their successors to build off their collaborative model. In their time on the DataSquad, the four have helped clients from a variety of backgrounds reach their research goals through data and worked tirelessly to make sure the model is sustainable beyond their graduation.
The four members of UCLA’s DataSquad have each provided an important role in this iterative process and collaborated together to reach this mission, even though they started on the team at different times.
Julia Wood - Norman Powell Data Science Consultant
Senior statistics major and digital humanities minor Julia Wood was the first to join the team in 2021, before the DataSquad was even officially established. During her time on the team, she consulted countless clients, taught multiple Tableau workshops, and trained Ethan after he joined the team in Winter 2022.
Throughout her time on the DataSquad, Julia helped research investigate topics from music fans on Twitter to gentrification in LA. Her final and most recent project involved Dr. Terrence of the UCLA Biocritical Studies Lab wherein she exemplified the data cleaning and visualization skills that made her a valuable asset to the DataSquad and all the clients she helped.
Speaking about how her work in the DataSquad changed her view on the project process, Julia said: “You take the right steps to make sure you don’t mess up.” She said that this is how DataSquad consultants can deliver final work that is “reputable, reproducible, and ready to be published.”
Julia will take the skills she’s learned on the DataSquad to Meta, where she will begin her career as a data scientist in the fall of 2022.
Keona Mae Pablo - Project Manager
Keona Mae Pablo is the DataSquad project manager and is a senior cognitive science major and digital humanities minor at UCLA. She worked since Fall 2021 to establish and implement the DataSquad model at UCLA. She designed and implemented workflows, helped hire the Squad, and managed their work. She also functioned as a liaison between the DataSquad staff and squadron workers to create an organized, well-functioning data science consulting team.
When asked about her work with the Data Squad, Keona Mae said: “I know the DataSquad is a valuable resource that the UCLA community will grow to love and appreciate, and I wouldn’t have been able to finish the year strong without the hard work of my team.”
Keona has accepted an offer to become a project manager at Plain Concepts following graduation.
Will Foote - Technical Writer/Norman Powell Data Science Consultant
Will Foote, a senior statistics major and public affairs minor at UCLA, has been working as the DataSquad’s Technical Writer as well as one of the team’s Norman Powell Data Science Consultants since Fall 2021. He wrote and put together the 2021 Recap and Spring 2022 newsletters for the Data Science Center. He has also published – and is writing more – blog posts on the DataSquad’s website to recap the team’s work.
Will has also completed numerous consulting projects as well. Notably, working with DataSquad International – the nascent global organizing group for the DataSquad – he has provided data analysis on survey results about student employment in data science support services at institutions worldwide. The DataSquad International team will present Will’s analysis on the DataSquad International website and at upcoming European and U.S. conferences.
Will is currently searching for data scientist or statistical consulting positions to begin his career following graduation.
Ethan Allavarpu - Norman Powell Data Science Consultant
Ethan Allavarpu, a statistics major at UCLA, was hired in Winter Quarter 2022 and has hit the ground running in his first quarter with the DataSquad. Since joining the team, he has worked on three projects and looks to take on more in his last quarter at UCLA.
Ethan worked with Julia on Dr. Terrence Keel’s research project on fatal encounters with police, in which he helped in the data cleaning and processing phases. He also analyzed geolocation helicopter data and created a program to parse text from Microsoft Word and PDF files using Python in his other two projects.
Following graduation, Ethan will be pursuing a Master of Science in statistics data science at Stanford University.
Moving Forward
The team hopes that through creating well-documented briefs on their well-organized procedures, the DataSquad can introduce a new way to think about student employment entirely: as one cohort handing the baton to the next, rather than simply being replaced by a new, independent generation.
The team has already hired the next two Norman Powell Data Science Consultants, Tristan Dewing and Shail Mirpuri who are both rising seniors. It is also currently in the hiring process of the next project manager and technical writer.
Regardless of who fills out the rest of the team’s roster, the first cohort is confident they’ve set the stage for sustained momentum of the DataSquad beyond themselves and excited to see where their successors take the model going forward.